Hamilton NZ has warm summers, cool winters and rain in every season. For trip planning, expect the warmest average afternoons in February, the coldest average mornings in July, and more rain in winter than in summer. Bring layers and check the current Hamilton forecast from MetService before making a weather-sensitive plan. The figures in this guide are long-term climate averages, not a prediction for your travel dates.
Hamilton, or Kirikiriroa, sits inland beside the Waikato River. A morning at Hamilton Gardens, a walk near Hamilton Lake and an evening in the central city can each feel different, even on the same day. This guide pairs verified climate data with practical local planning. It is for visitors choosing when to come, residents planning a day out, and anyone trying to understand what “Hamilton weather” usually means.
Data note: The monthly figures below are the National Institute of Water and Atmospheric Research (NIWA) 1991 to 2020 climate averages for its Hamilton, Ruakura 2 EWS station. The data represent average conditions across the reference period. A particular year, week or day can differ substantially. Figures are rounded to one decimal place and were checked on 22 September 2026.
Hamilton weather at a glance
NIWA’s Hamilton station has an annual mean air temperature of 13.9°C and average annual rainfall of 1,124.2 mm for 1991 to 2020. February has the highest average daily maximum at 25.1°C. July has the lowest average daily minimum at 3.8°C and the highest average monthly rainfall at 124.2 mm. February has the lowest monthly rainfall average at 65.0 mm. These are station averages, not a guarantee that February will be dry or July will rain every day.
| Month | Average daily high | Average daily low | Average rainfall |
|---|---|---|---|
| January | 24.6°C | 12.8°C | 75.4 mm |
| February | 25.1°C | 13.1°C | 65.0 mm |
| March | 23.4°C | 11.4°C | 75.4 mm |
| April | 20.3°C | 9.1°C | 92.3 mm |
| May | 17.2°C | 6.8°C | 103.3 mm |
| June | 14.8°C | 4.7°C | 117.8 mm |
| July | 14.1°C | 3.8°C | 124.2 mm |
| August | 14.9°C | 4.7°C | 106.5 mm |
| September | 16.6°C | 6.5°C | 100.1 mm |
| October | 18.1°C | 8.1°C | 86.0 mm |
| November | 20.1°C | 9.4°C | 79.0 mm |
| December | 22.5°C | 11.9°C | 99.2 mm |
Source: NIWA’s mean daily maximum, mean daily minimum and mean monthly rainfall tables for Hamilton, Ruakura 2 EWS, 1991 to 2020. “Average daily high” and “average daily low” describe the mean of daily maxima and minima, not record extremes. Swipe the table horizontally on a small screen.
Climate averages are not today’s forecast
Climate describes typical conditions over many years; weather describes what is happening now or expected soon. NIWA uses long-term statistics, normally around 30 years, to describe the climate at a station. A 65 mm rainfall average for February does not tell you whether the Saturday you visit will be dry. Equally, a rainy day in February does not make the long-term figure wrong.
For a trip in the next few days, use MetService’s Hamilton forecast and check the latest warnings before leaving. Recheck close to your departure time, particularly for outdoor events, river paths and long drives. A forecast may change as new observations arrive. This page is the place to decide what a season is usually like; MetService is the place to decide whether to take an umbrella tomorrow.
Summer in Hamilton: December to February
Summer offers Hamilton’s warmest average daytime temperatures. The NIWA station’s mean daily maximum rises from 22.5°C in December to 24.6°C in January and 25.1°C in February. Average daily minima sit between 11.9°C and 13.1°C across those months. It is possible to have a much hotter or cooler day than those averages, so plan around the actual forecast rather than the table alone.
February has the lowest average monthly rainfall in the NIWA Hamilton table at 65.0 mm. That makes summer attractive for a Hamilton Lake outing, a visit to Hamilton Gardens or a walk beside the Waikato River. It does not mean rain is unusual or impossible. Keep a flexible indoor option for a day when showers or thunderstorms interrupt a plan. Check opening details with each place directly before travelling.
Summer packing is simple: breathable clothes, comfortable walking shoes, a water bottle, a light layer for evening and a compact rain jacket. Sun protection matters even when the air does not feel especially hot. SunSmart New Zealand advises protection when the UV Index is 3 or more, and notes that UV can still be high on cooler or cloudy days. Shade, clothing, a hat, sunglasses and sunscreen are sensible for a long afternoon outside.
Autumn in Hamilton: March to May
Autumn changes gradually rather than overnight. The average daily high at Hamilton’s NIWA station moves from 23.4°C in March to 20.3°C in April and 17.2°C in May. Average daily lows move from 11.4°C to 9.1°C and then 6.8°C. A warm March afternoon can feel close to summer; a May morning calls for a proper extra layer.
The rainfall averages also rise through autumn, from 75.4 mm in March to 92.3 mm in April and 103.3 mm in May. That pattern is more useful for packing than a promise of dry weekends. If you are planning things to do in Hamilton, choose the main outdoor stop first and keep a museum, gallery or café in mind if conditions change. The Waikato Museum guide is one starting point for a weather-flexible afternoon.
For an autumn visit, pack layers that work in both a mild afternoon and a cooler evening. A rain jacket is more useful than planning your entire trip around a long-range forecast. If you are walking on paths or visiting Hamilton markets, footwear that handles a wet surface is a practical choice. Confirm current opening times and any event changes with the operator.
Winter in Hamilton: June to August
Winter is cool rather than snowy. The NIWA station’s average daily high is 14.8°C in June, 14.1°C in July and 14.9°C in August. Average daily lows are 4.7°C, 3.8°C and 4.7°C respectively. July is therefore the coldest month in the table by both the average high and average low. These are averages: an individual morning can be colder and frost can occur.
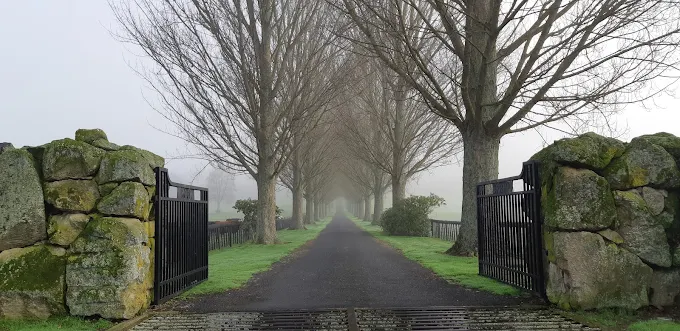
Rain is a larger part of winter planning. The NIWA monthly averages are 117.8 mm in June, 124.2 mm in July and 106.5 mm in August. In its Waikato climate report, NIWA also describes a regional winter rainfall maximum and documents fog and frost at Hamilton-area stations. That does not mean every winter day is wet or foggy. It means you should allow for those conditions when planning early starts, outdoor seating or a drive beyond the city.
Snow is not a normal city-centre expectation in Hamilton. If your question is whether you should pack snow gear for a standard Hamilton visit, the answer is no. A warm layer, waterproof outer layer and shoes with grip will be more useful. Conditions in higher parts of the wider Waikato and Central Plateau are different; check the forecast for the actual destination rather than using Hamilton’s city averages for a regional road trip.
Winter can still make a good Hamilton day. Give yourself time for an indoor activity, a relaxed meal, or a short outdoor walk when the weather permits. The museum, food and dining guides and accommodation guide offer ways to shape a flexible visit. Check each venue’s current arrangements directly.
Spring in Hamilton: September to November
Spring’s average temperatures rise steadily. NIWA records average daily highs of 16.6°C in September, 18.1°C in October and 20.1°C in November; average daily lows are 6.5°C, 8.1°C and 9.4°C. A jacket is still useful in the morning, even if a later afternoon feels mild. This is a season for easy-to-remove layers rather than a single outfit chosen from the midday temperature.
Spring is not automatically dry. Hamilton’s 1991 to 2020 rainfall averages are 100.1 mm in September, 86.0 mm in October and 79.0 mm in November. NIWA’s Waikato climate report notes that spring is generally the region’s windiest season, and its Hamilton wind observations show a greater share of strong-wind occurrences in spring than in the other seasons. If you are planning a picnic, cycling route or outdoor event, wind and rain forecasts matter as much as the temperature.
Hamilton Gardens and the city’s green spaces are natural spring ideas, but blooms, ground conditions and event programmes vary. Use our Hamilton Gardens guide for local context, then check the Gardens’ official visitor information for current access. SunSmart advice applies in spring too: cool air does not necessarily mean low UV.

Which month is best for a Hamilton visit?
There is no single month that suits every visitor. If warm average afternoons matter most, January and February are the strongest candidates in the NIWA table, with February the warmest. If you prefer milder walking weather, consider March, April, October or November. If your trip is built around a particular show, game or gathering, choose the event date first and use the seasonal averages only to decide what to pack.
For a family day, it is usually more useful to build two versions of the plan than to chase a supposedly perfect month. Pair an outdoor place such as Hamilton Lake or Hamilton Gardens with an indoor option and a flexible meal stop. Our featured attractions and things to do guides can help you choose. Check the live forecast and each attraction’s current information before you go.
If rain is your main concern, note the difference between a monthly average and a specific date. NIWA’s Hamilton table shows February as the lowest-rainfall month on average, but it still records rainfall. July has the highest monthly average, but it still has dry days. A weather-dependent ticket or long outdoor booking deserves a fresh forecast and a look at the operator’s cancellation policy.
Fog, frost and wind: the details averages miss
A monthly average compresses many different days into one number. It does not show the mist you may meet on an early drive, the sun that breaks through later, or the breeze that makes a mild afternoon feel cooler. NIWA’s Waikato climate report documents fog and frost in the Hamilton area and describes spring as a generally windier period for the region. These are useful tendencies, not a timetable. If visibility or road conditions matter, use a current forecast and road updates, not a historical average.
Fog is most relevant to the start of a day. If you have a flight, a long drive or an early outdoor booking, allow enough time to respond to the conditions you actually find. A cold night can also leave grass or paths damp or frosty even if the afternoon forecast looks pleasant. For a walk, choose shoes with grip and consider moving your outdoor stop later if the morning is uncomfortable. None of this means the day’s plan has to be cancelled; it means building in room to change the order.
Wind deserves its own check when you are packing for an open space. A temperature that sounds mild on a phone screen may feel different beside the river or at an outdoor event. A close-fitting outer layer is often easier to manage than a loose umbrella. If severe weather is forecast, follow MetService warnings and the relevant operator’s advice. Do not use a general visitor guide as a safety instruction for a specific weather event.
Build a day that can change with the weather
For a first visit: pick one outdoor highlight, such as Hamilton Gardens or the lake, and one nearby indoor alternative. Look at the short-range forecast the night before and again in the morning. If the clear spell shifts, reverse the order of your stops. You still see the city without having to force a wet walk into a fixed itinerary.
For a family outing: plan around comfort rather than trying to fit every attraction into one day. Pack a spare layer for children, water for warm days and a way to shorten the outdoor portion if needed. For a market or outdoor performance, check the organiser’s own page for weather-related changes. Our market guide explains which options are recurring and where to find current organiser details.
For a weekend stay: look at the forecast for each day, not one symbol for the entire weekend. Put the most weather-sensitive activity in the better-looking window and leave a flexible morning for food, culture or shopping. Our accommodation guide, attractions guide and maps guide can help connect the stops without locking you into a single route.
The common principle is simple: choose what matters most, check current conditions, and have a second good option. Hamilton has things to do in every season. A realistic plan leaves room for a change in weather and makes it easier to enjoy the day you actually get.
Compare typical temperatures, rainfall and daylight before choosing when to travel. They describe a long period, not your exact visit.
Check the short-range forecast for rain, wind and temperature, then confirm opening and event details with the organiser.
A practical Hamilton packing list
- All year: comfortable walking shoes, a light layer and a way to check the live forecast.
- Summer: breathable clothes, drinking water, shade or a hat, sunglasses, sunscreen and a light rain layer.
- Autumn: layers for cooler evenings and a rain jacket, especially later in the season.
- Winter: a warm layer, waterproof jacket and shoes with grip for wet or frosty mornings.
- Spring: removable layers and wind or rain protection for changeable outdoor plans.
This is a planning checklist, not a substitute for the forecast. If your itinerary includes another Waikato location, check that location separately: a Hamilton city average should not be applied to the coast, hills or high country. For getting around the city, our Hamilton maps guide and bus guide can help you plan a backup route when the weather changes.
Planning for this week, not an average year?
Use this guide for the season. Use the current Hamilton forecast and warnings for your actual travel day.
Hamilton NZ weather FAQs
What is the coldest month in Hamilton NZ?
July is the coldest month in NIWA’s 1991 to 2020 Hamilton station averages. Its mean daily high is 14.1°C and its mean daily low is 3.8°C. Individual mornings can be colder, so check the forecast if you have an early start.
What is the hottest month in Hamilton?
February has the highest average daily maximum, 25.1°C, in NIWA’s 1991 to 2020 Hamilton data. This is an average of daytime highs, not the maximum temperature ever recorded.
How much rain does Hamilton get?
The NIWA Hamilton, Ruakura 2 EWS table gives 1,124.2 mm of mean annual rainfall for 1991 to 2020. A different station or reference period can give a different number. July is the wettest month in this table at 124.2 mm on average; February is the lowest at 65.0 mm.
Does it snow in Hamilton, New Zealand?
Snow is not a normal feature of a Hamilton city winter. Cool mornings, frost, fog and rain are more relevant to everyday planning. Conditions in higher parts of the wider region can differ, so check the forecast for the exact place you intend to visit.
Is Hamilton weather good for outdoor activities?
Outdoor activities are possible throughout the year, but the most comfortable choice depends on your preferred temperature and the forecast for the day. Summer has the warmest average afternoons; winter is cooler and wetter on average. Check wind, rain and UV as well as temperature before planning a long day outside.
Where should I check today’s Hamilton weather?
Use the MetService Hamilton forecast for current conditions, upcoming weather and warnings. Historical climate averages on this page cannot tell you whether a particular event day will be wet.
Sources and how to use this guide
All numerical monthly temperature and rainfall statements in this article come from NIWA’s 1991 to 2020 Hamilton, Ruakura 2 EWS tables. The NIWA climate data index explains the datasets and links to the original files. Additional context on Waikato fog, wind and seasonal rainfall comes from NIWA’s Waikato climate report, which uses its own station data and periods. Those sources describe historical patterns; they do not provide a live forecast.
For travel on a particular day, consult MetService. For sun exposure, see SunSmart New Zealand’s UV guidance. HamiltonNZ provides local ideas and links, but event schedules, access, prices and weather can change. Check the relevant organiser or operator before you travel.